s

Analytics Dashboard
Helping a company visualize their value add to customers.
︎ Goal
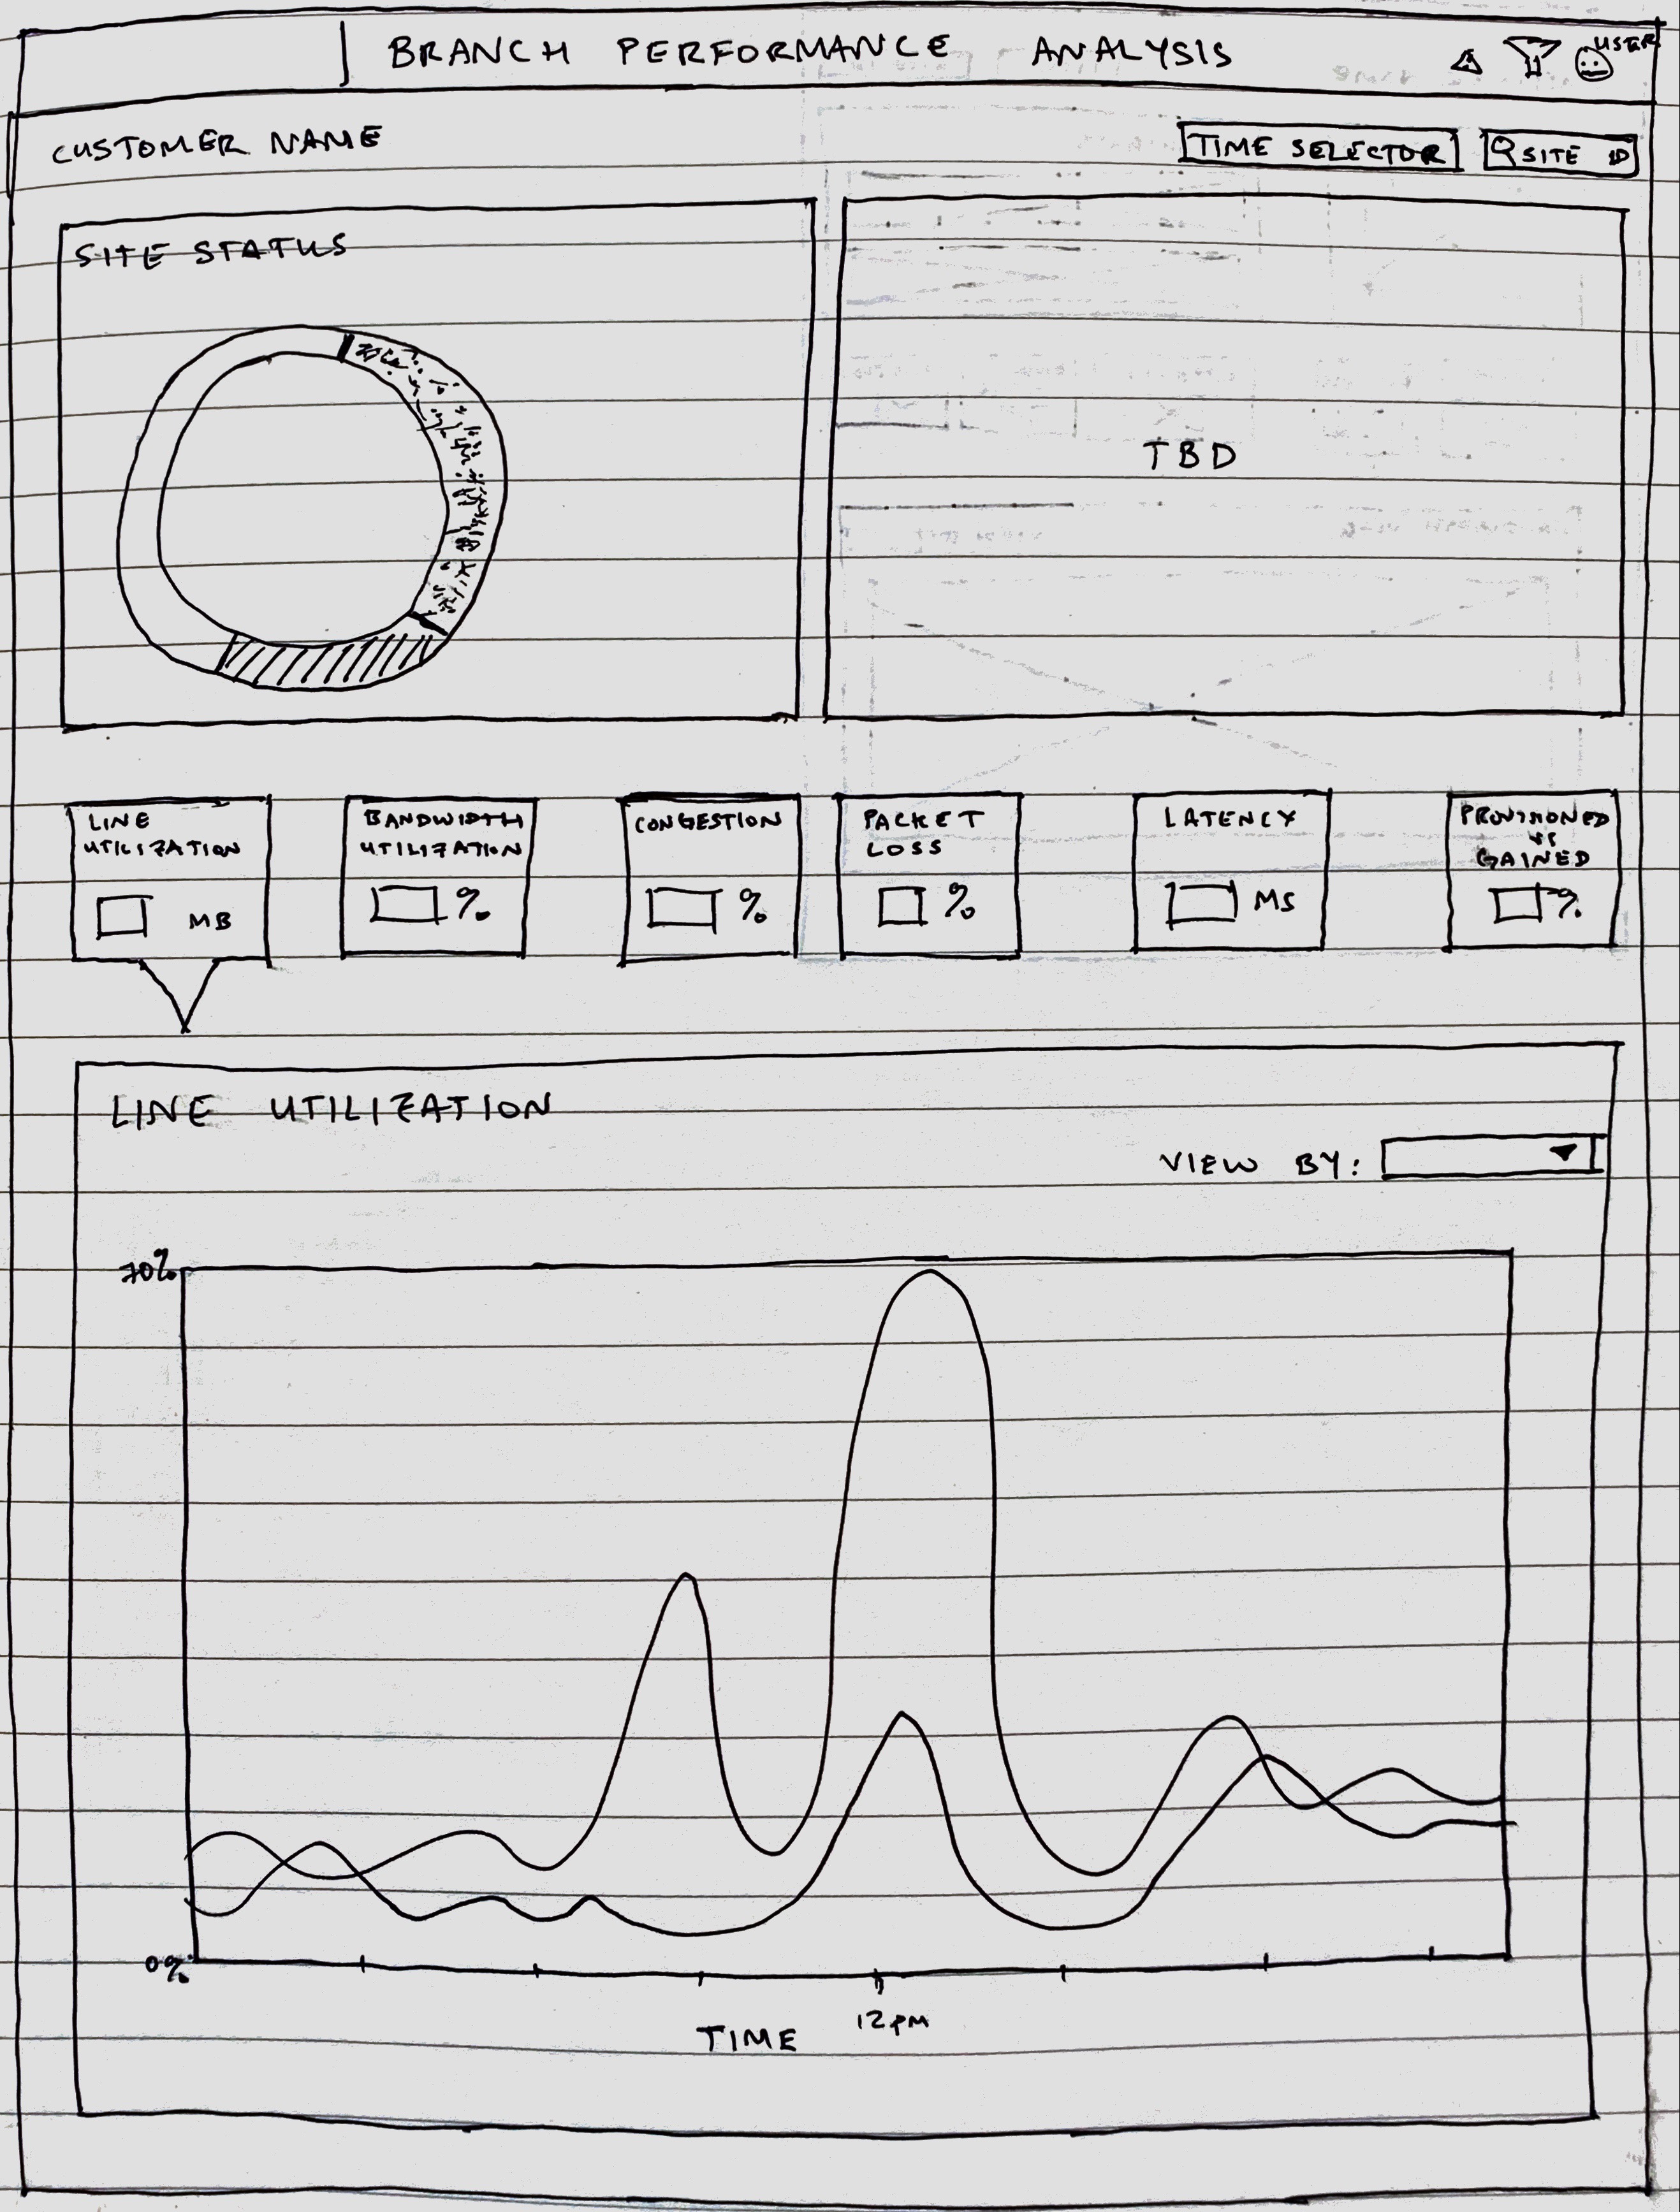
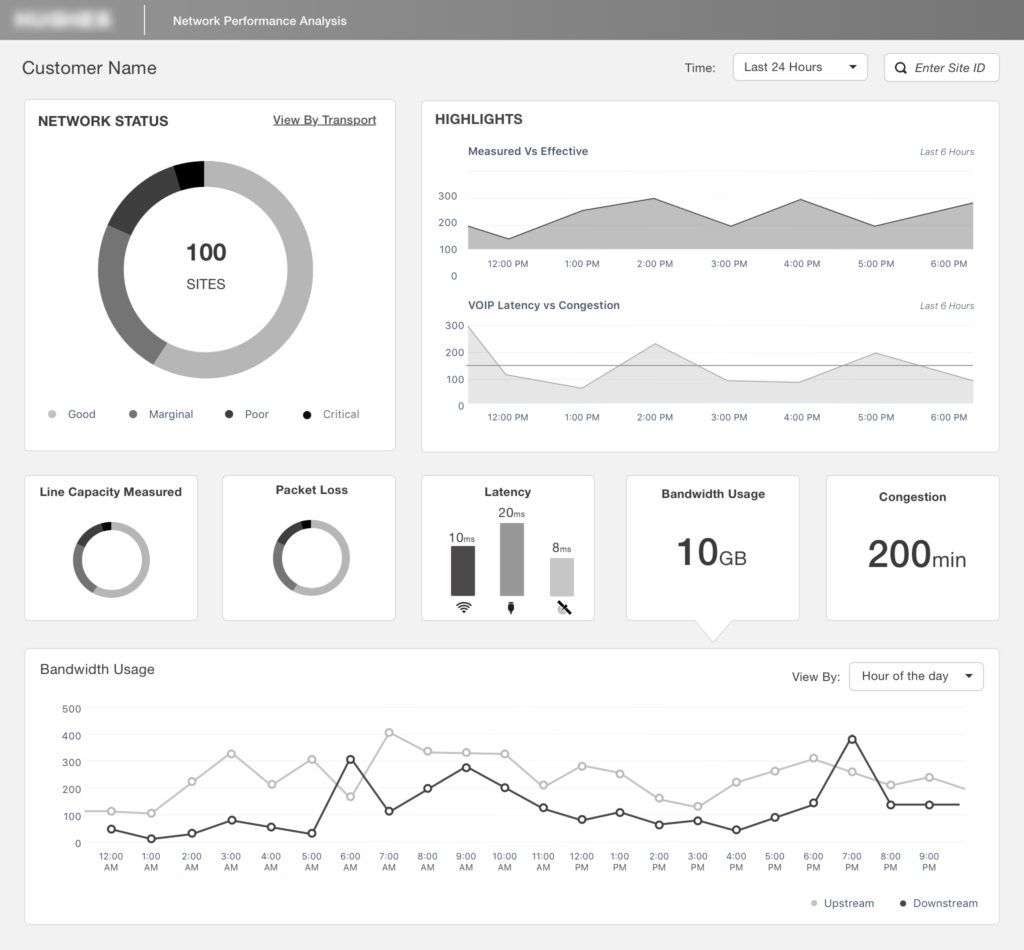
Meetings took place at the client's office with the end users, who are network engineers and marketing professionals. After discovering the key performance indicators and business needs, the dashboard design came to life and the value-add to client’s customers can be seen in the "Measured vs Effective" graph on the upper right-side of the dashboard.
The color mockup served as a reference for development. Using MicroStrategy, this design was built, loaded with data, and fully implemented and was showcased at the client's user conference, where its customers saw a live demo.
︎ Challenge
A provider of satellite-based communications services needed a dashboard to measure network performance across all of their customers’ locations. First, the client needed the dashboard to visually depict the value-add they were bringing to their customers. Second, the solution needed to be scalable across different sized customers. Finally, the dashboard had to be detailed enough to provide meaningful business insights.
︎ Role
Discovery, Wireframing, UI Design and Development
︎ Back to Portfolio
Research & Discovery
It was very crucial in this project to learn the basics and advanced nuances of human-centered design. The primary users of this new digital dashboard have been used to running their own analytics through an external calculating source (Excel or external data analytics programs) that did not naturally sync with the company’s data.
The most important part of my design strategy for this project was to conduct interviews and research with the employees’ current workflow. Through this exploration, key insights were pulled surrounding how they pull and process data, what tests are conducted with it, any “short cuts” they use while interacting with data, and layouts of their current data processing systems. As a team, we reviewed and summarized the findings of the research and used that as a base point for creating a system design for the dashboard.
In addition to scholarly research and customer interviews, we conducted a comparative analysis of various system vendors to determine pros, cons, feasability, technical integrartions, maintenance upkeeps, and other metrics to evaluate the success of deploying a certain system over another.
![]()
![]()
![]()
![]()
![]()
![]()
The most important part of my design strategy for this project was to conduct interviews and research with the employees’ current workflow. Through this exploration, key insights were pulled surrounding how they pull and process data, what tests are conducted with it, any “short cuts” they use while interacting with data, and layouts of their current data processing systems. As a team, we reviewed and summarized the findings of the research and used that as a base point for creating a system design for the dashboard.
In addition to scholarly research and customer interviews, we conducted a comparative analysis of various system vendors to determine pros, cons, feasability, technical integrartions, maintenance upkeeps, and other metrics to evaluate the success of deploying a certain system over another.